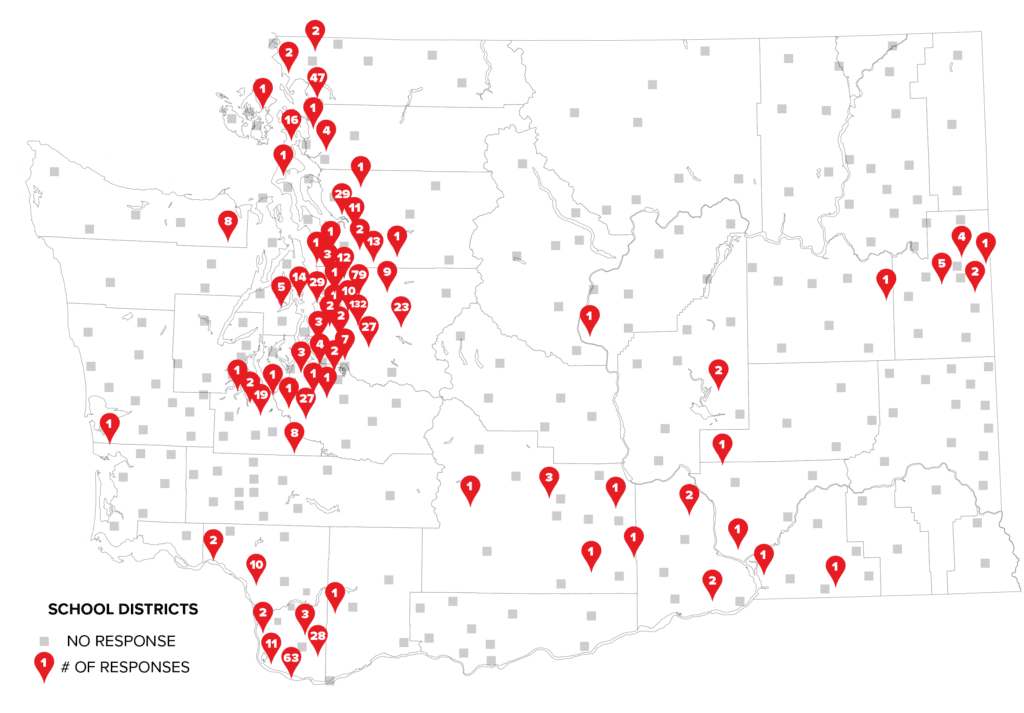
As mentioned in Part One, to help direct our work with our community to create positive change in Washington’s education system, we sent out a survey via email and social media channels in May to learn how Washington community members would like state education funding prioritized. We thank the 737 people, from 71 school districts across the state, who submitted responses.
Our survey first offered respondents an opportunity to rank 16 pre-established funding priorities to make the most difference for students [view results in Part One]. Then respondents had the opportunity to write in other priorities. Over 58% of the respondents added further priorities.
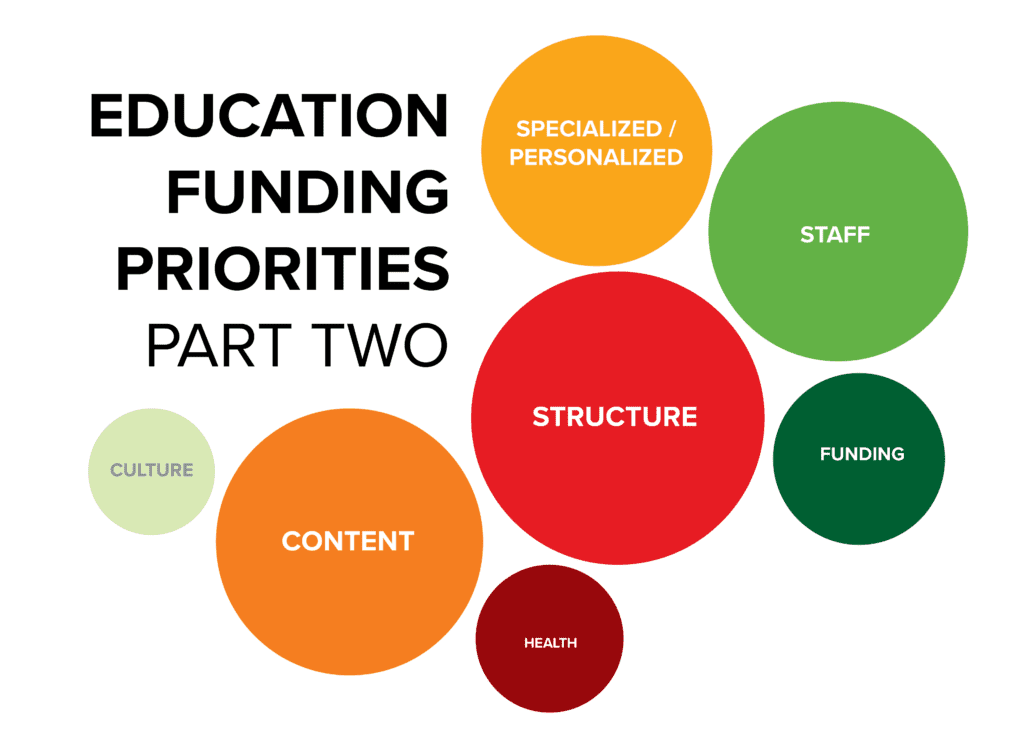
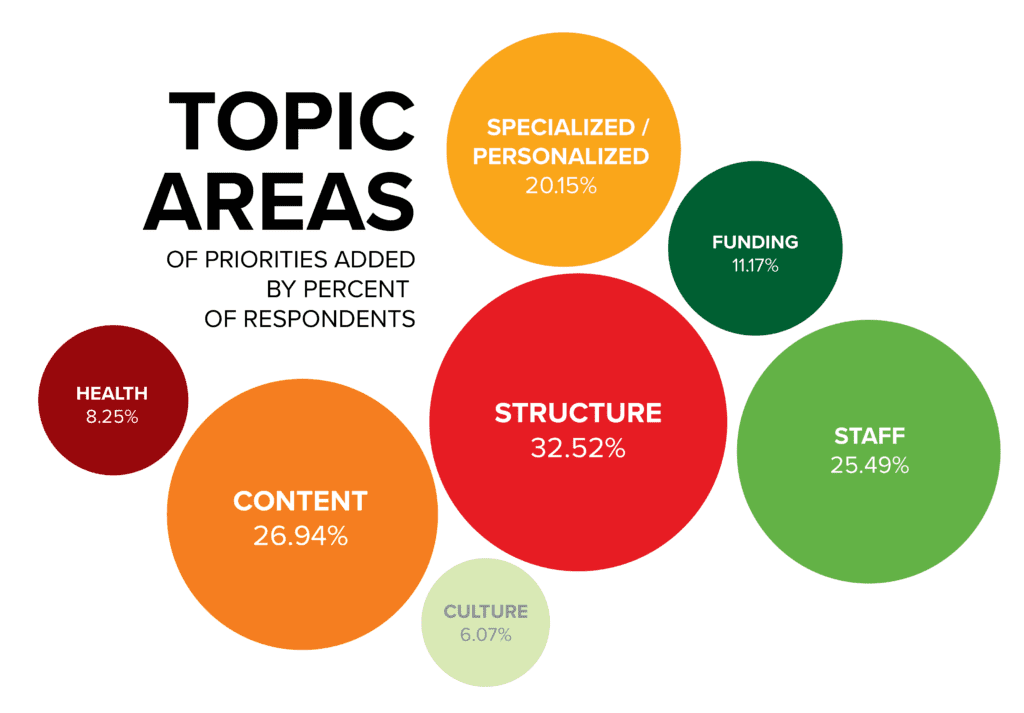 Topic Areas
Respondents most commonly mentioned the structure (facilities, resources, safety, schedule, etc.), content (art, vocational, etc.), staffing (educator pay, professional development, etc.), and specialized or personalized learning (special education, highly capable learning, etc.) as other areas to invest in to make the most difference for students. Also mentioned but less common was how the funds are dispersed, health, and culture.
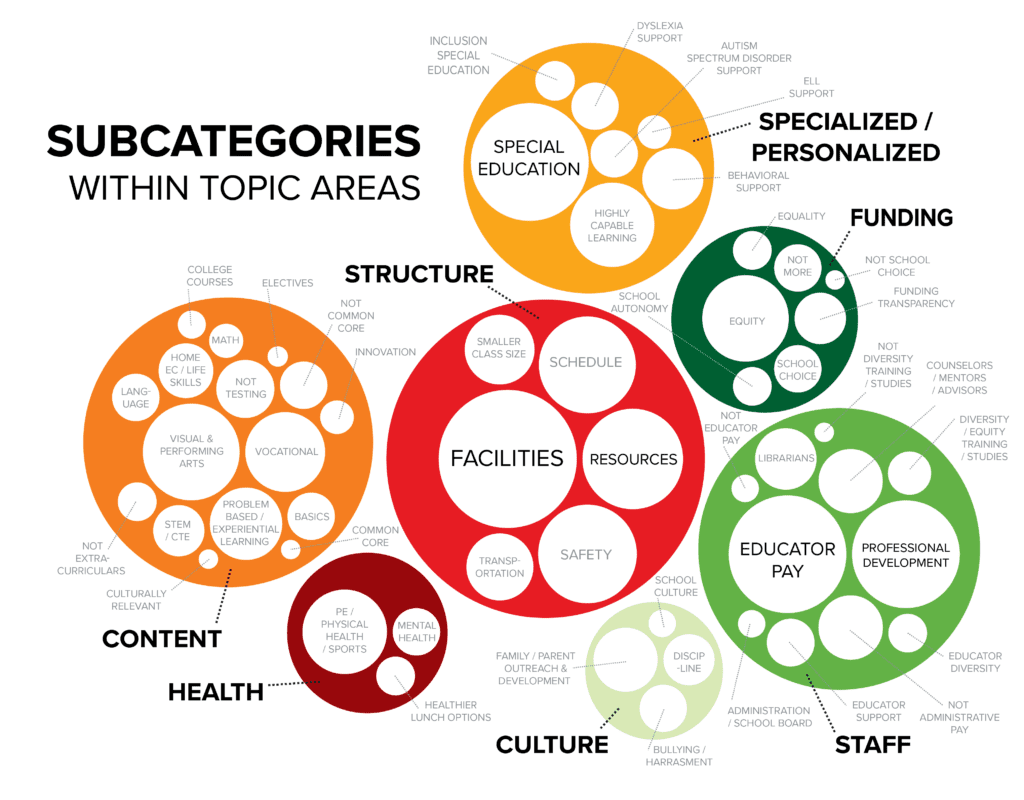
Subcategories
Within the seven broad areas, there were 54 subcategories. The most commonly mentioned subcategory was facilities. Special education and educator pay tied in second, then professional development, resources, and safety. The most common requests within these most commonly mentioned subcategories were as follows: 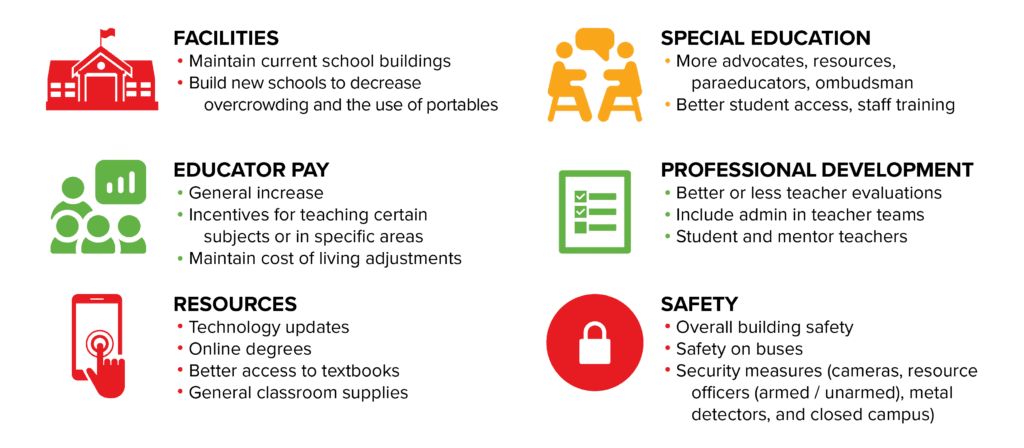
Respondent Proportionality
However, as mentioned in Part 1, while we received responses proportionate to the population of middle to high socioeconomic status school districts, there was a disproportionality for lower socioeconomic school districts. Therefore, we parsed out the data based on school districts’ percentage of students on Free and Reduced Priced Lunch (FRPL), a common marker for socioeconomic status, to make sure we were understanding the priorities of our entire state.
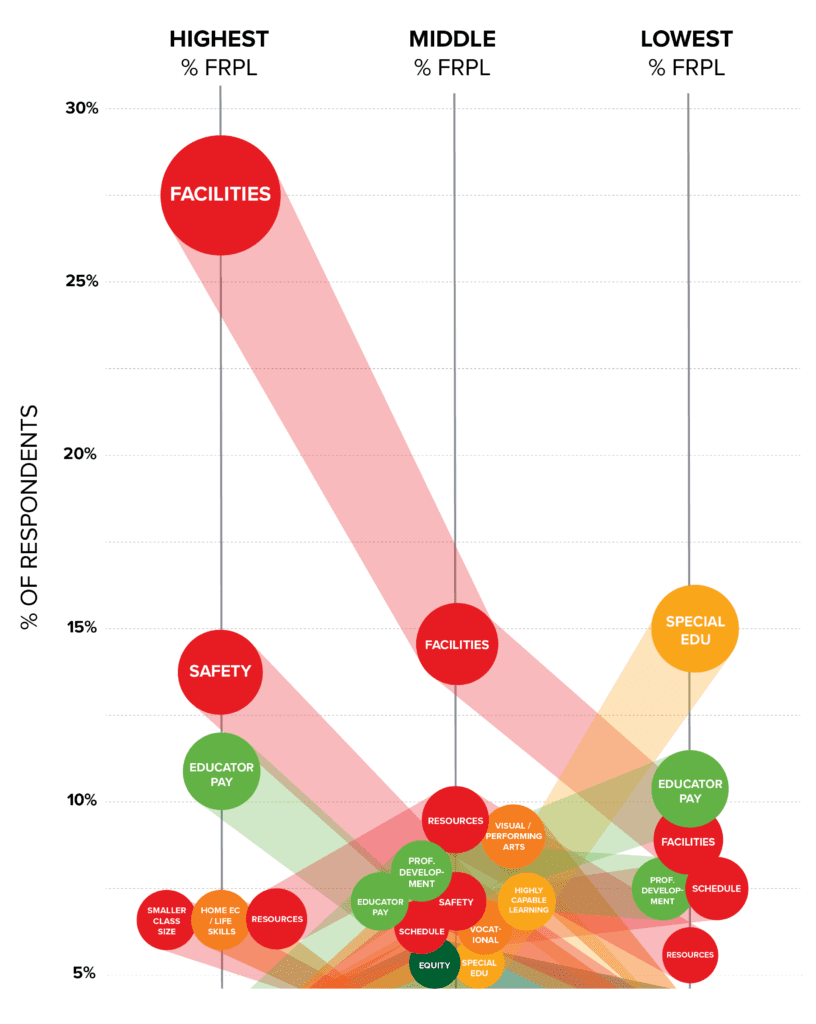
Differences
We saw a larger difference in priorities amongst different socioeconomic groups. Most glaringly, almost 30% of the respondents from school districts with the highest percentage of students qualifying for FRPL requested facilities investments, and this percentage decreases by half for middle percent FRPL districts and half again for the lowest percent FRPL districts.
Funding Inequity
This seems to emphasize the inequity resulting from facilities being funding almost solely by local levies and bonds, therefore reflecting the local socioeconomic status. To start to mitigate this, in 2007 LEV helped pass House Joint Resolution 4204, an initiative allowing a simple majority of voters to authorize local school district levies (such as Maintenance and Operations levies), increasing the opportunity for school districts to pass levies. However bonds such as construction bonds, which are used to build new schools, still need a supermajority to pass.
Among many other equity focused projects, League of Education Voters is already advocating for a simple majority to pass bonds. In addition we will continue to refine our goals with this community input.
To view the full report read Part One or the PDF.
If you did not have a chance to complete the survey and do not see your priorities reflected in this summary, please contact us. We will make sure to include your input in our ever-evolving understanding of Washington state’s community education funding priorities.
-Emma
Funding Priorities Survey Full Report [Printable PDF]
Love what we do? Support our work
Want to find out the latest in education news in Washington? Subscribe to our newsletter
Want to learn more about League of Education Voters? Find out here